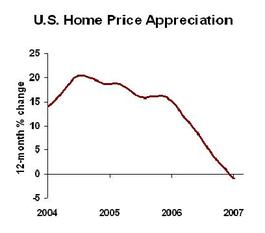
Home prices have turned south. The 12-month percent change is now negative:
(Technical note: Data are the S&P/Case-Shiller Home Price Index, which is a composite of the top 20 markets. This is a repeat home sale index, meaning that it’s not the average or the median selling price, but a cute index formed in the following way: let’s create a set of index numbers which best match actual price changes. The actual price changes are found from Fannie Mae/Freddie Mac data, when a home mortgage transaction occurs now, and the data shows a previous transaction in past years. The data are millions of pairs of prices, one price reflecting an old transaction, the second price reflecting the second transaction on the same house. The index is the set of numbers which best match all of those price appreciation/depreciation data. The actual level of the index is meaningless, but the percentage change in the index is our best estimate of the average change in prices of existing homes. Get it?)
The Big Picture points out that it’s been over a decade since the 12-month change was negative. By my tally, 11 of the top 20 markets had negative 12-month price change. This is all consistent with my observation that we have about 3 million more vacant homes than normal.
Business Strategy Implication: It’s not so much the subprime problem that puts the economy at risk, it’s the overhang of too many homes, pushing prices down and discouraging consumers from spending money so freely. Do your business contingency planning.


