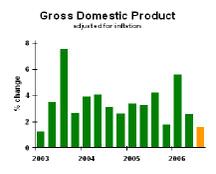
GDP growth was weak, as expected.
(Refresher course on GDP: GDP is the value of the goods and services produced in the U.S. On an inflation adjusted basis, which the chart shows, the long-run sustainable growth rate is about 3%, so look for deviations above or below 3%. Ignore a difference of one or two tenths of a percent–just noise in the data.)
The decline in the growth rate came from two sources: the housing slowdown, and the third quarter increase in imports, due to oil. (Imports subtract from GDP because they constitute spending by Americans on goods we did not produce.)
In general, the report was not a surprise, though a tad weaker than the consensus. I was at 1.8%, whereas the actual came in at 1.6%. This is probably the worst we’ll see this round of slowing. Although housing will continue to decline, it’s rate of decline should mellow out. And our imports will decline.
Although I’ll be making some minor modifications to my forecast next week, the big picture will remain the same.
Business strategy implications: if you are outside the housing construction sector and its food chain, the economy will feel about the same in the next year as it has in the past. If you are part of the residential construction sector, however, look for even more weakness.


